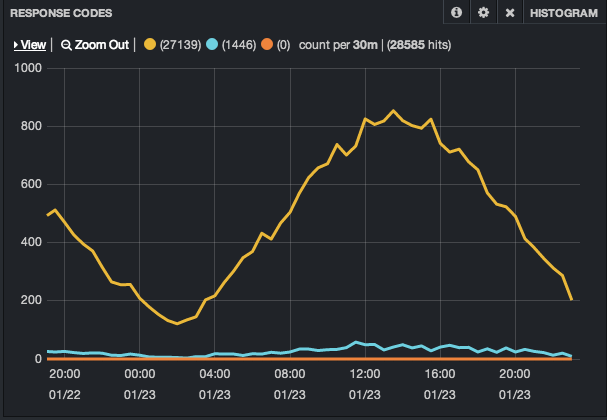
HTTP Response Codes Graph
Zohar Arad. © 2014
Monitoring is about knowledge, control and reaction.
We monitor stuff so we can meet our SLA without losing sleep.
An imaginary application for restaurant recommendations
When monitoring a monolithic application, we usually look at a limited number of things for breakage
Now, let's imagine we break up our monolithic application into specialized services
| Monolithic | Service-Oriented | |
|---|---|---|
| Node Types | Few | Many |
| Log Sources | Few & Similar | Many & Different |
| Monitored Endpoints | App / DB / OS | Apps / APIs / DBs / OS |
| Actionable Data Size | Small / Medium | Medium / Large |
| Data Location | Relatively Close Together | Dispersed |
We're trying to find problems / sore points by finding anomalies in log data.
In monolithic setups, we usually work with smaller data sizes, from limited number of types and sources.
When moving to service-oriented setups, our log data sources grow in number and variance.
Therefore our challenges lie in dealing with larger sizes of variable sources of data effectively and efficiently.
Let's see how we can monitor our new Web application and social login services.
Look at Nginx access logs and find HTTP requests with status 200, 404, 500
Anomalous HTTP statuses signify breakage that need our attention
Kibana is a visual interface for interacting with large amounts of aggregated log data.
Kibana's working assumption is that log data analysis is a good way to find problems
        input {
            file {
                type => "nginx_access"
                path => ["/var/log/nginx/**"]
                exclude => ["*.gz", "error.*"]
                discover_interval => 10
            }
        }
        output {
            elasticsearch {
                host => "es01.wheretoe.at"
                port => "9300"
            }
        }
Nginx -> LogStash -> Elastic Search

HTTP Response Codes Graph
As our architecture evolves into small distributed services, our ability to find problems in each service becomes more limited.
Our challenge is finding anomalies in large, variable amounts of data and do something with our findings.
| Problem | Solution |
|---|---|
| Data Variance | LogStash (Grok) |
| Data Aggregation | LogStash |
| Data Size | Elastic Search |
| Data Querying | Elastic Search |
| Visualization | Kibana |
Boss: Zohar?
Me: Yes?
Boss: Users can't login to our system...
Me: Wasting an hour only to find out disk is full on login02.wheretoe.at
Let's see how we can monitor our login service KPI.
Check OS health (disk, load, memory) & number of active logins and SMS if things go wrong
* kept to minimum for sake of simplicity
We want to define a set of parameters that define the operational norm, check these parameters periodically and handle abnormalities.
For example: High CPU and low number of logged-in users indicate we have a problem in our users DB server.
        "check_load": {
          "command": "/etc/sensu/plugins/system/check-load.rb -c 5,10,15 -w 3,7,10",
          "interval": 60,
          "subscribers": ["common"],
          "handlers": ["sms", "graphite"]
        }
        "sms": {
          "command": "/etc/sensu/handlers/notifications/pagerduty.rb",
          "severities": [ "warning","critical" ],
          "type": "pipe"
        }
Our challenge is to identify abnormal events in the ongoing operation of our system components and react to them in real-time.
We can check anything we like (it's just a Ruby script)
We can handle results in multiple ways based on criteria (eg. always send to Graphite, but only SMS when critical)
Presentation: http://goo.gl/68A2bj
E: zohar@zohararad.com | Github: @zohararad | Twitter: @zohararad